How to Use Your Procurement Spend to Calculate Your Scope 3 Emissions (for Australian & New Zealand Companies)

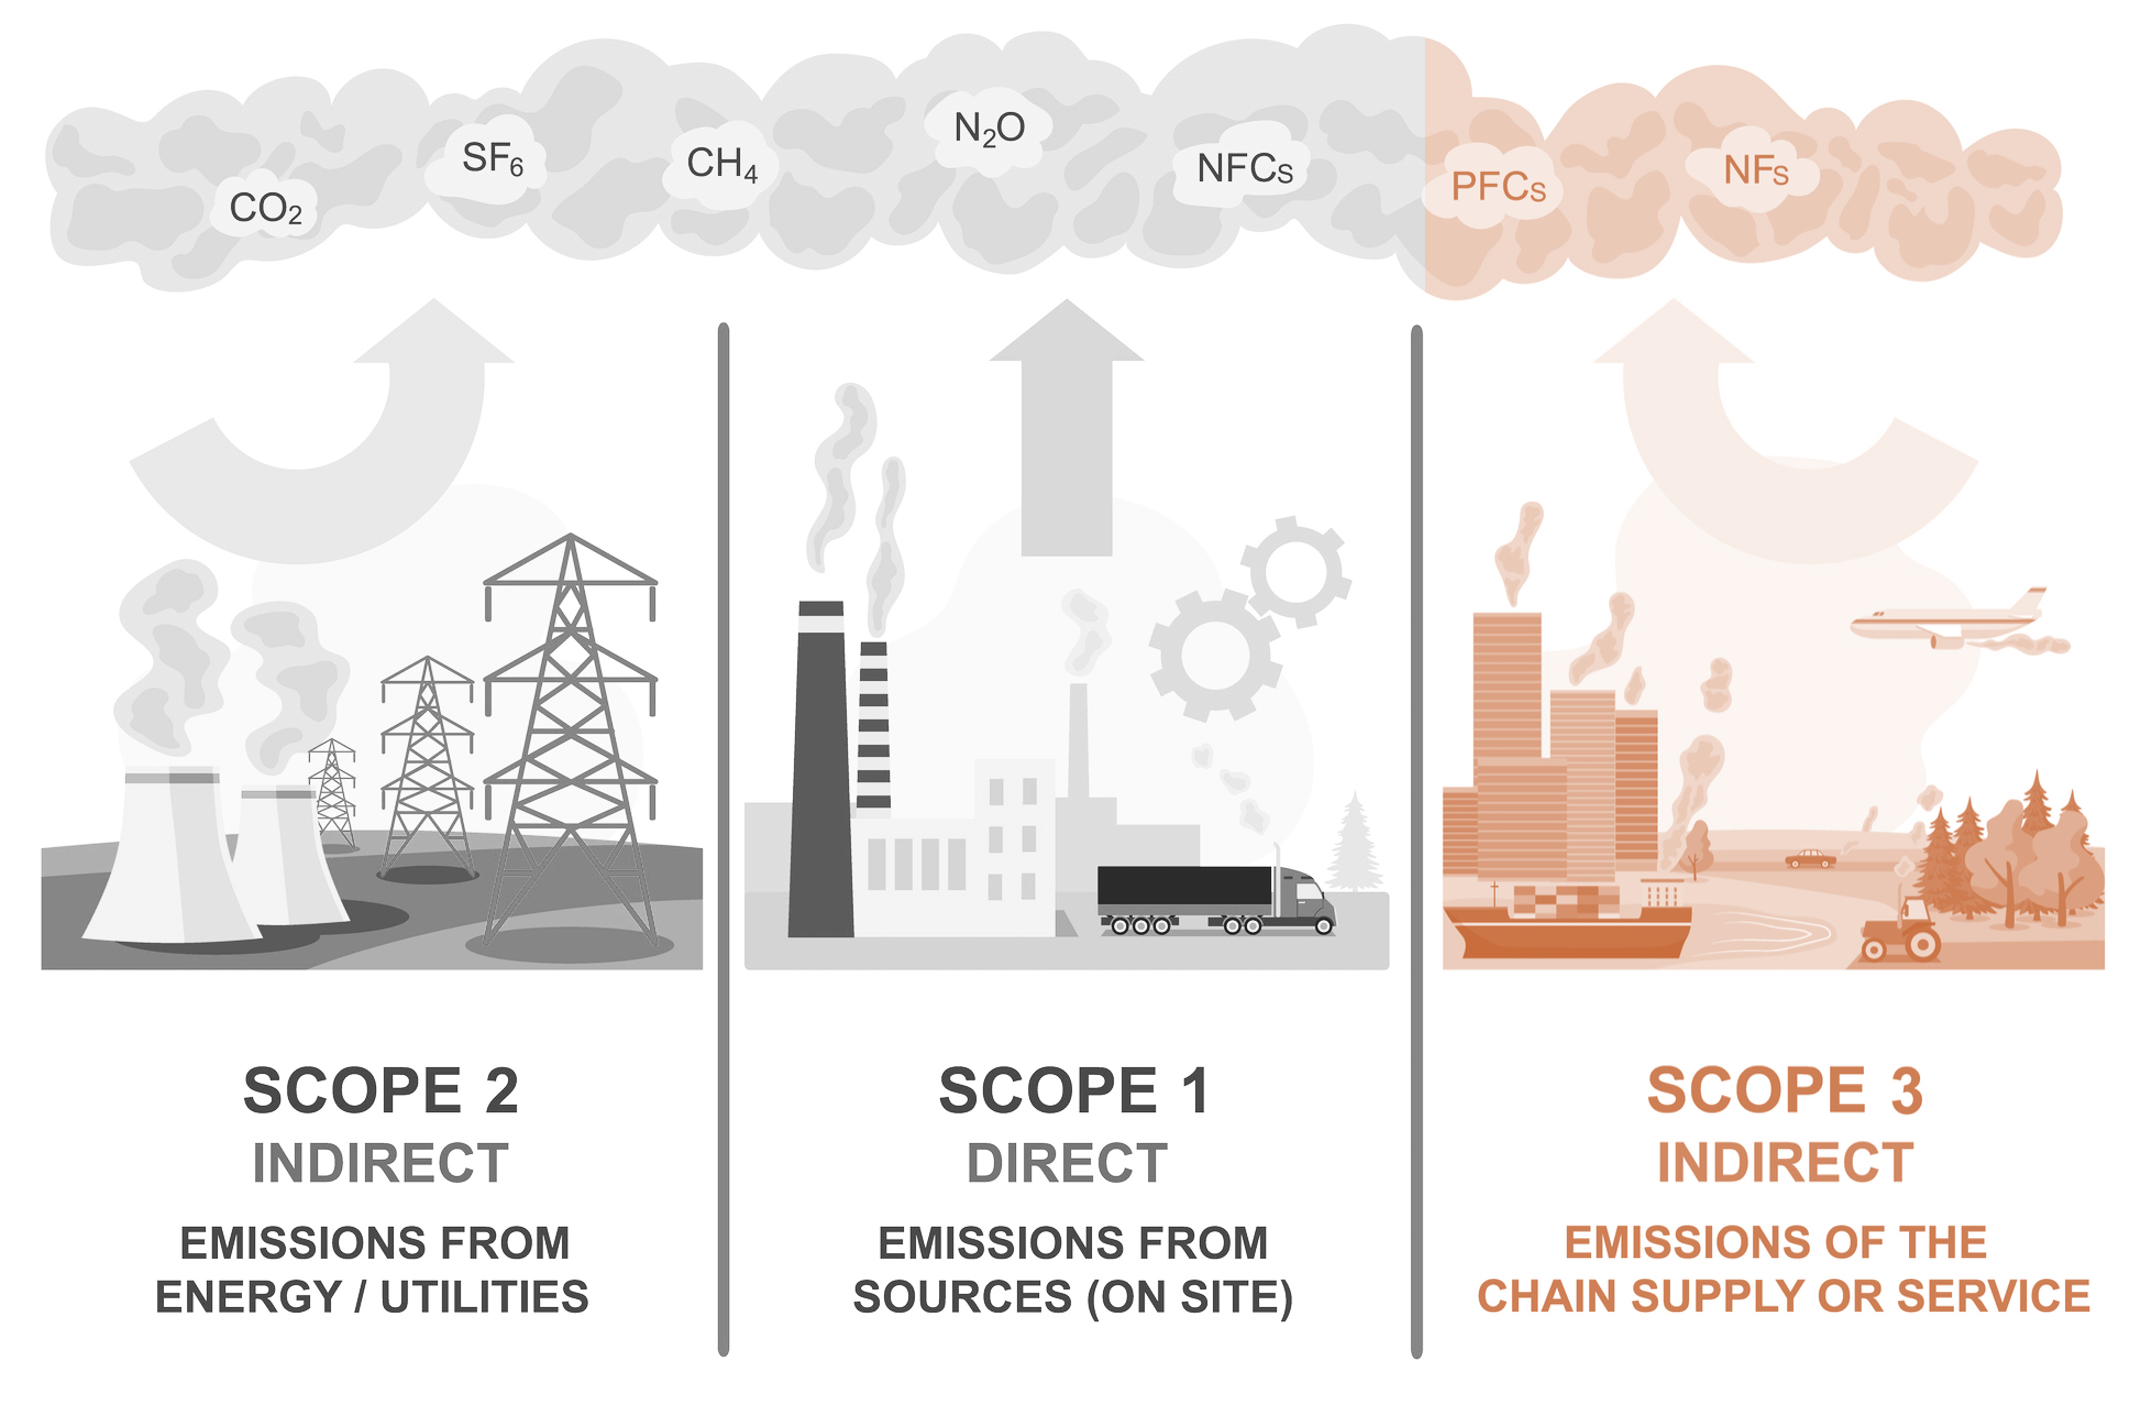
With growing ESG requirements in Australia, organizations are increasingly required to measure and report on their carbon emissions, especially focusing on Scope 3 (indirect) emissions, which include all activities within your supply chain.

Initially, this challenge can seem daunting—how do you gather detailed information about your suppliers and their activities to estimate the carbon dioxide they produce? For those using the Australian National Greenhouse Accounts Factors to estimate Scope 3 emissions, the process may not feel any simpler.

The good news is that there’s a relatively straightforward, approved, and widely used approach that can give you a good indication of your emissions without the exhaustive task of tracking down every activity within your supply chain: the Spend-Based Carbon Calculation method.

In this article, we’ll outline this method, its pros and cons, practical tips, and some alternatives.

What is the Spend-Based Carbon Calculation Method?

Put simply, this method involves taking your procurement spend and applying a specific factor based on the classification of each spend category. Here’s an example:

Example: $1,000,000 spent on electricity x 0.3 kg CO₂ per dollar = 300,000 kg of CO₂

In this example, for every million dollars your organization spends on electricity, 300,000 kg of CO₂ is produced. By applying these factors across each spend category, you can estimate your total CO₂ emissions. For additional context, typical carbon emission factors for categories like transportation, utilities, and waste management can vary widely, so it’s essential to use accurate, updated factors to achieve meaningful results.

For those interested in the technical aspects, the Spend-Based Carbon Calculation method leverages procurement spend data classified under the Australian and New Zealand Industry Classification (ANZSIC) standard. Then, using Environmentally Extended Input-Output (EEIO) models—a top-down approach for estimating emissions—you apply a factor to each classification.

Breaking Down the Process into Three Simple Steps

      1. Match Your Spend Classification to the Closest ANZSIC Code
        ANZSIC, or the Australian and New Zealand Industry Classification, is a standard classification used by Australian and NZ governments, such as in the Australian Bureau of Statistics (ABS). If you use IBISWorld for market research, its reports also follow this classification.

        If you’ve already classified your procurement spend data to ANZSIC, you’re all set for this step. If not, you may need to translate your spend taxonomy into ANZSIC codes. AI tools can assist with this, or if you need additional support or a full list of ANZSIC codes, reach out to us at SpendSphere.ai.

        Tip: It’s common to encounter challenges when translating custom spend categories into ANZSIC codes. If your data doesn’t neatly fit, try classifying at a broader level, or consider enlisting a third-party service like SpendSphere.ai for guidance.

      1. Use an Approved Database of Conversion Factors
        Next, obtain a database with emission factors for all ANZSIC codes. Using updated conversion factors is essential as emission profiles can evolve over time.

        Tip: Set a reminder to review and update your conversion factors periodically (e.g., annually) to ensure accuracy.

      1. Multiply Your Spend by the Relevant ANZSIC Carbon Emission Factor
        With the necessary data in hand, use Excel (or similar software) to:
            • Generate a report of your spend by ANZSIC classification over the past 12 months

            • Apply a lookup formula to find the corresponding emission factor.

            • Multiply spend by the emission factor for each classification.

            • Sum the total to get your organization’s CO₂ emissions based on procurement spend.

      This calculation provides a baseline estimate of your Scope 3 emissions.

      Automating the Process

      If you’re looking to streamline and automate this process, consider using tools like SpendSphere.ai, which integrates these steps directly into your procurement and sustainability systems.

      Next Steps: Using Scope 3 Data for Actionable Insights

      With a clear view of your Scope 3 emissions based on procurement spend, you can take several actions to manage and reduce your carbon footprint.

          1. Set Baselines and Targets:
            Use this initial calculation to establish a baseline for Scope 3 emissions, allowing you to set realistic reduction targets aligned with your company’s sustainability goals.

          1. Engage with Key Suppliers:
            Identify high-emission suppliers and collaborate with them to reduce emissions. Encourage greener practices, such as renewable energy use or supply chain efficiencies, as part of a broader sustainability initiative.

          1. Track and Report Progress:
            Incorporate this spend-based method into your regular reporting cycle to monitor reductions over time, highlight improvements, and transparently communicate your ESG progress to stakeholders.

          1. Consider Alternative Methods for Greater Precision:
            While the spend-based method is practical and accepted, some organizations may later transition to more detailed analyses, especially for critical suppliers or high-impact categories. For instance, direct emissions reporting or process-based carbon accounting might be more suitable for high-impact suppliers or strategic procurement categories.

          1. Automate and Streamline Reporting:
            Automation tools like SpendSphere.ai simplify the process, integrating it directly into procurement and sustainability systems for consistent, accurate Scope 3 reporting.

        Final Thoughts

        Achieving accurate and actionable Scope 3 emissions data doesn’t have to be complex. By leveraging the Spend-Based Carbon Calculation method, you can establish a solid foundation for tracking and managing your environmental impact. Whether you’re just beginning or refining your approach, SpendSphere.ai can support you at every step, helping you turn insights into actionable sustainability improvements.

        Contact Us

        Ready to take control of your Scope 3 emissions?

        Contact us at SpendSphere.ai to get started. Together, we can build a more sustainable and transparent supply chain for your organization.
        What are my options for implementing Spend Analytics for my organisation?

        When you’re considering implementing spend analytics for your organisation, the approach you choose will greatly affect how quickly you see results, the quality of insights you gain, and the overall return on investment (ROI). To help you decide which path suits your procurement needs, let’s explore your options and the pros and cons of each.

        1. Existing Financial or Purchase Order System Reporting
        2. Excel Analysis using data from your Financial System
        3. Build it yourself – with a number of tools like Power BI / Tableau
        4. Get your internal “Business Intelligence” Team to build a solution for you
        5. Get a Procurement Consultant top build it for you (or provide standard dashboards)
        6. Implement a purpose-built Spend Analytics Solution

        1. Existing Financial or Purchase Order System Reporting

        One of the most straightforward options is to use the built-in reporting tools that come with your financial (aka ERP) system I.e. SAP, Oracle, Technology One, Pronto, etc) or your Purchase Order system (ie. Coupa).

        Pros:
        These are often ready to use right out of the box, making them immediately available without any additional software costs. Built-in tools keep your data consistent by centralising it in one place, which reduces the chances of errors. Plus, if your team is already familiar with the ERP system, there’s little to no learning curve.

        Cons:
        However, these built-in reports can be quite rigid, offering limited flexibility for deeper customisations. As your reporting needs grow, you might find that these tools aren’t scalable enough to support more complex analytics. ERP systems typically offer only basic reporting and lack the advanced analytics, predictive modelling, or visualisation tools that more specialised platforms provide. Additionally, since you are reliant on the vendor for updates and improvements, you might find yourself constrained by the ERP’s capabilities, especially if the vendor doesn’t upgrade as quickly as your needs evolve.

        2. Excel Analysis using data from your Financial System

        For many organisations, Excel remains a go-to tool for reporting and analysis.

        Pros:
        It’s cost-effective and widely available, with most employees already proficient in its use. With Excel, you have the freedom to tailor reports and analyses to suit your exact needs without being restricted by predefined templates. It’s especially useful for smaller datasets, where you can quickly manipulate the data and generate insights.

        Cons:
        But while Excel offers a familiar interface, it has limitations—particularly when dealing with large datasets. Extracting and updating data manually can be time-consuming, and as the volume of data grows, Excel struggles with scalability, often leading to performance issues or crashes. Collaboration can also become a challenge, as sharing reports without proper version control can result in confusion or errors. Finally, manually handling sensitive procurement data in Excel can increase the risk of data breaches or corruption.

        3. Build it yourself – with a number of tools like Power BI / Tableau

        If you’re looking for a more advanced solution, tools like Power BI offer dynamic dashboards, interactive visualisations, and the ability to manage larger datasets.

        Pros:
        These tools are scalable, meaning they can handle increasingly complex queries and larger volumes of data. One of the key advantages of Power BI is the ability to automate data refreshes, which saves time and reduces manual intervention. Furthermore, Power BI integrates with multiple data sources, so you can build a more comprehensive view of your procurement activities. It also encourages a self-service approach to reporting, enabling business users to create or modify reports without waiting for IT.

        Cons:
        Building your own spend analytics system using tools like Power BI or Tableau can have some significant drawbacks. One major challenge is the need to piece together multiple systems that you may not have full control over. These systems can change without your knowledge or notice, which can cause disruptions in your reporting processes. Even when the tools are set up, manual processes may still be required to ensure they work together smoothly, adding inefficiencies and increasing the risk of human error.

        There are also concerns about ongoing support and potential breaking changes. Updates to one of the systems could cause compatibility issues with the others, requiring constant monitoring and adjustments to maintain functionality. This can lead to significant maintenance demands, and without proper documentation, troubleshooting problems can become time-consuming and costly. Additionally, building a system from disparate tools often creates a single point of failure—if one component breaks down, the entire analytics solution could stop working.

        Given these issues, building your own system may not be the best long-term solution. The ongoing maintenance requirements, along with the need for continuous updates and support, can make it unsustainable as your business grows or evolves.

        4. Get your internal “Business Intelligence” or IT Team to build a solution for you

        For a highly tailored solution, you could engage your IT department to develop an integrated Power BI reporting system that is designed specifically for your business.

        Pros:
        This approach allows for complete customisation to meet your unique needs. IT can ensure that data is consistently extracted, cleansed, and managed, while also automating data integration from multiple sources. Security is another benefit, as IT can enforce strict data governance protocols, protecting your sensitive procurement data. A system developed by IT is also scalable, and designed to grow alongside your business as reporting needs become more complex.

        Cons:
        The downside to this approach is that it can be time-consuming, especially if your IT department has other priorities. You may find yourself dependent on IT for updates or changes, which could slow down your agility in responding to changing business conditions. Custom solutions also come with higher upfront development costs and will require ongoing maintenance as your requirements evolve. Finally, this would probably be the first time that the business has created a Spend Analytics tools so while they could probably get some basic reporting done quickly, understanding the requirements of what a Procurement Function needs to be effective, could take considerably longer and therefore significantly increase the cost.

        5. Get a Procurement Consultant to build it for you (or provide standard dashboards)

        Pros:
        Hiring a procurement consultant to build your spend analytics solution offers several key advantages. Their expertise ensures that the system is developed according to industry best practices and is customised to meet the specific needs of your business. Consultants often accelerate the implementation process by providing pre-built dashboards or ready-made solutions, allowing you to see results faster. This also reduces the burden on your internal IT team, as consultants manage the integration with existing systems, making the transition more seamless. Additionally, their ability to tailor the system to your exact requirements provides flexibility and scalability as your business grows.

        Cons:
        Despite these benefits, this approach can result in a similar challenge to building the system yourself—connecting disparate systems that may not fully integrate. Over time, this could lead to the same long-term issues of managing a fragmented solution, with multiple systems that need constant coordination and updates. From a long-term perspective, this could make the solution as difficult to maintain and scale as a DIY approach, requiring ongoing manual processes and maintenance to keep everything working together.

        6. Use a purpose-built Spend Analytics Solution

        Another option is to purchase a ready-made spend analytics solution.

        Pros:
        These programs are designed with industry best practices in mind, often offering predefined metrics, reports, and insights that align with procurement needs. An off-the-shelf solution can be implemented quickly, providing faster time to value compared to building a custom system. Many of these programs offer advanced analytics features such as machine learning, predictive analytics, and benchmarking against industry standards. They’re also scalable and flexible, allowing for deep customisation as your business grows. Additionally, you benefit from continuous updates and ongoing support provided by the vendor, keeping the system current with minimal effort on your part.

        Cons:
        However, off-the-shelf solutions can be expensive, with ongoing licensing or subscription fees adding to the total cost. Integration with your existing systems—particularly if your ERP has proprietary formats—might present some challenges. While these programs are flexible, they may not cover every specific need of your business, and you’ll be dependent on the vendor for any updates or fixes, which can limit your control over the system.

        Summary:

        In the past, organisations had limited options for spend analytics, often relying on Excel, ERP reports, or DIY data visualisation and a bunch of bespoke data cleaning and categorisation tools. Today, customizable, purpose-built solutions offer powerful insights that procurement teams can grow into over time.

        Selecting the right approach depends on your strategic goals, organization size, data complexity, and budget. If data analytics, especially spend management, is a core competency and strategic focus, an internally built solution may be ideal. For others, the “Build or Buy” decision requires thoughtful evaluation to balance immediate needs with long-term value.